

Written and reviewed by Brandon VanLandingham, CFA, CMT, CFP® · Last updated November 13, 2026
Risk-Adjusted Return: Sharpe, Sortino, and What They Actually Mean
Read the risk definition before comparing the score
November 13, 2026
Two portfolios can earn the same average return and expose their owners to very different experiences. One may deliver a few unusually strong gains and modest losses. Another may look steadier most of the time but suffer a deeper setback. A return number alone cannot tell you which experience better fits your plan.
Risk-adjusted measures try to put the return beside the variability used to produce it. Sharpe and Sortino ratios are useful examples, provided their definitions remain visible. I would use them to ask better questions about a strategy. I would not choose a retirement portfolio because one ratio was the highest on a comparison sheet.
What the Sharpe ratio compares
In its common cash-benchmark application, the historical Sharpe ratio divides average periodic excess return by the standard deviation of those excess returns. Excess return means portfolio return less the matching period's risk-free benchmark return. William Sharpe's original explanation of the ratio sets out the differential-return framework and distinguishes historical measurement from expectations.1
The numerator asks what was earned beyond the comparator. The denominator measures how much those periodic outcomes varied around their average. Both favorable and unfavorable deviations contribute to standard deviation. A large positive surprise can therefore increase the denominator even though the investor was pleased to receive it.1
This is why the dates and measurement frequency belong beside the number. Comparing a ratio calculated from monthly observations over one interval with a ratio calculated from daily observations over another interval does not isolate a manager's skill. A changing cash benchmark also needs to be handled consistently. Subtracting today's yield from an old multi-year return is not the same calculation as measuring period-by-period excess returns.
Sortino changes the question
The Sortino ratio compares mean return above a chosen target with downside deviation relative to that target. The target is often called the minimum acceptable return. It can differ from a risk-free benchmark. CFA Institute's discussion of the Sortino ratio explains why both the target and the calculation convention matter.2
For the example below, downside deviation means the square root of the average squared shortfall below the target, counting all observations in the denominator. Observations at or above the target contribute zero shortfall. This differs from taking the standard deviation of only the negative returns. A data provider using another convention can produce another number from the same return history.2
Changing the target also changes the interpretation. A positive return can be a shortfall relative to a higher target. Before treating a Sortino ratio as reassurance, ask what hurdle it uses and whether that hurdle makes sense for the decision. A target selected to make the statistic flattering is not a planning objective.
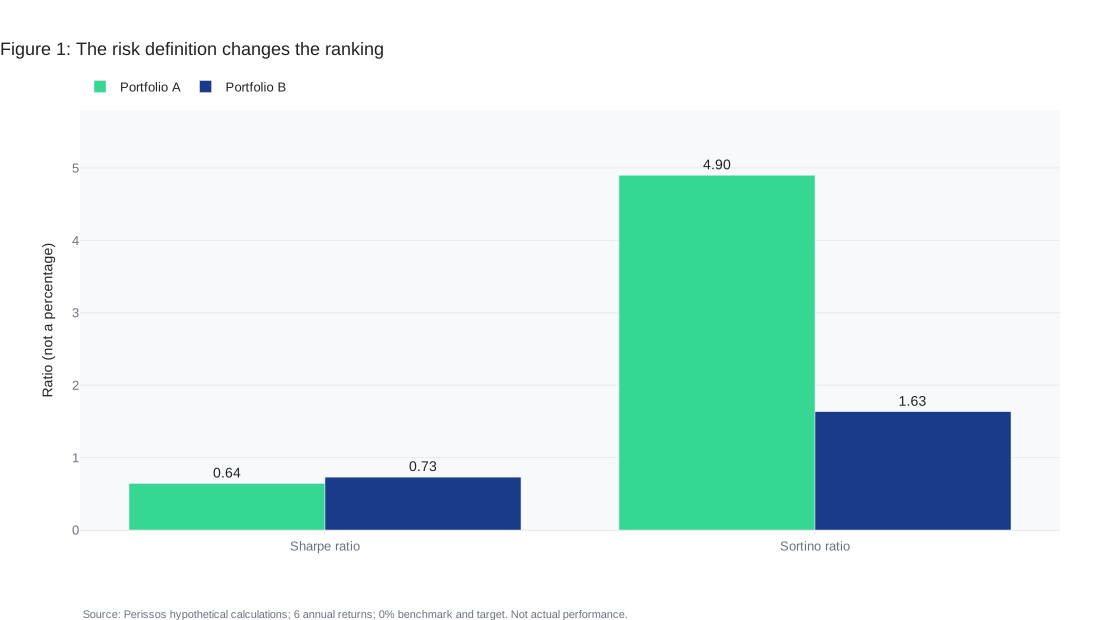
The same average can produce opposite rankings
Figure 1 compares two invented sets of six annual returns. Portfolio A has returns of negative 2%, 1%, 2%, 3%, 4% and 16%. Portfolio B has returns of negative 6%, 2%, 5%, 6%, 8% and 9%. Both have an arithmetic average return of 4%. Assume a constant 0% risk-free benchmark and a 0% downside target solely to make the mechanics easy to see. These are not current cash yields or recommended return assumptions.
Using sample standard deviation, A's variability is 6.23%, compared with 5.48% for B. Their Sharpe ratios are approximately 0.64 and 0.73, respectively. B ranks higher under that measure. Under the stated downside convention, A's downside deviation is 0.82%, versus 2.45% for B. Their Sortino ratios are approximately 4.90 and 1.63. A now ranks higher.
The reversal has an identifiable cause. A's unusually strong positive year increases its total variability, while B has the larger shortfall below zero. Neither calculation is a forecast. These are six deliberately selected observations with no fees, taxes, withdrawals or other cash flows, and the ratios use annual observations without an additional annualization step. The example demonstrates definitions, not the merits of actual portfolios.
There is another distinction hidden in the word average. The arithmetic mean of annual returns is not the compounded annual growth rate. For example, a hypothetical 20% gain followed by a 20% loss leaves 96 cents from each starting dollar, despite an arithmetic average of zero. Ask which return measure appears in a presentation before connecting it to future dollar wealth.
What a favorable ratio leaves unanswered
Neither measure states the largest peak-to-trough decline, the time needed to recover, or whether money was available when the household needed it. The same observations rearranged in time preserve these sample ratios, while changing the path of account values. Withdrawals make the order of outcomes especially relevant to the family's remaining resources.
A short history also cannot contain every possible adverse event. A strategy can look attractive within the observed sample without demonstrating how it would behave during a different environment. I would want to see the underlying holdings and economic exposures, not only the statistics calculated from past observations. Infrequent valuations warrant questions about whether the recorded series captures changes in realizable value promptly.
The SEC's performance-claims bulletin encourages investors to examine methodology, costs and the suitability of comparisons.3 A ratio built from gross returns should not be presented as though it represents the client's net experience. Ask about actual versus simulated results, the selected start date, and whether the comparison includes difficult periods.
Our discussion of the practical limits of Modern Portfolio Theory extends this issue to household constraints. A mathematically attractive allocation can still be inappropriate if it leaves too little accessible money for spending or requires selling assets the family cannot readily sell.
Use the statistics where they help
These ratios are most useful as part of a consistent comparison: similar mandates, identical dates, the same observation frequency, disclosed targets and comparable fee treatment. A family evaluating two ways to fill the same portfolio role can use a difference in ratios to investigate the return pattern that produced it. That investigation may reveal a meaningful tradeoff rather than a clear winner.
They are poorly suited to ranking every asset a household owns in one league table. A spending reserve, long-term growth allocation and illiquid business interest have different jobs. Nor should an investor interpret a large Sortino ratio from a sample with almost no downside observations as proof that losses are unlikely. A zero denominator can leave a ratio undefined; it does not create a riskless investment.
Make the review about the plan
At the next portfolio review, request the return series and calculation definitions alongside the ratios. Add drawdown depth, recovery time, liquidity terms, concentration and the dollars needed for upcoming expenses. If the portfolio is taxable, coordinate the consequences of proposed changes with the CPA. A small improvement in a historical statistic may not justify the cost of restructuring an appreciated portfolio.
Then connect the analysis to a forward-looking planning exercise. Our memo on stress-testing retirement with Monte Carlo analysis discusses how assumptions affect modeled outcomes. The useful decision is whether the portfolio can support the family's obligations under uncomfortable conditions, and what spending, allocation or reserve changes would be available if it cannot. A ratio earns its place when it helps answer that question.
All my best,
Brandon VanLandingham, CFA, CMT, CFP
Founder / CIO
Citations
- William F. Sharpe, The Sharpe Ratio (retrieved October 23, 2026).
- CFA Institute, The Sortino Ratio: Is Downside Risk the Only Risk that Matters? (retrieved October 23, 2026).
- SEC, Investor Bulletin: Performance Claims (retrieved October 23, 2026).
Important Disclosures
This piece is educational. It is not legal, tax, or accounting advice and is not a recommendation to take or refrain from any specific action. Tax law is fact-specific and changes regularly. Please coordinate any decisions discussed here with your attorney, your CPA, and Perissos before acting.
Perissos Private Wealth Management is a Registered Investment Adviser ("RIA"). Registration as an investment adviser does not imply a certain level of skill or training, and the content of this communication has not been approved or verified by the United States Securities and Exchange Commission or by any state securities authority. Perissos Private Wealth Management renders individualized investment advice to persons in a particular state only after complying with the state's regulatory requirements, or pursuant to an applicable state exemption or exclusion. All investments carry risk, and no investment strategy can guarantee a profit or protect from loss of capital. Past performance is not indicative of future results.
The information contained in this newsletter is intended to provide general information about market themes. It is not intended to offer investment advice. Investment advice will only be given after a client engages our services by executing the appropriate investment services agreement. Information regarding investment products and services is given solely to provide education regarding our investment philosophy and our strategies. You should not rely on any information provided in making investment decisions.
Market data, articles and other content in this material are based on generally available information and are believed to be reliable. Perissos Private Wealth Management does not guarantee the accuracy of the information contained in this material.
Perissos Private Wealth Management will provide all prospective clients with a copy of our current Form ADV, Part 2A (Disclosure Brochure), Part 2B (Supplemental Brochures), and Part 3 (Client Relationship Summary) prior to commencing an advisory relationship. You can also view these documents at any time at adviserinfo.sec.gov or by contacting us requesting a copy.
Frequently Asked Questions
- What is the main difference between the Sharpe and Sortino ratios?
- The Sharpe ratio uses total return variability, including upside and downside surprises, while the Sortino ratio focuses only on shortfalls below a chosen target. That means the same return history can rank differently under each measure.
- Can two portfolios with the same average return have different risk-adjusted scores?
- Yes. In the example, both portfolios averaged 4%, yet Portfolio B had the higher Sharpe ratio and Portfolio A had the higher Sortino ratio because their patterns of volatility and downside shortfall differed.
- Why do dates, frequency, and targets matter when comparing these ratios?
- A ratio based on daily observations over one period is not directly comparable with one based on monthly observations over another period. For Sortino, changing the target return also changes what counts as downside risk.