

Stress-Testing Your Retirement Plan With Monte Carlo Analysis
Use the probabilities to improve the decisions behind your plan
September 30, 2026
A retirement report can tell you that your plan has an 85% probability of success without answering the question you actually care about: What would have to change if the difficult years arrived early? I would rather understand the spending adjustment behind a disappointing result than take comfort in an impressive percentage whose assumptions nobody has challenged.
Monte Carlo analysis can help with that conversation. It tests many hypothetical paths instead of assuming investments earn the same return every year. Its value lies in comparing decisions under uncertainty. It cannot tell you which future will occur, and a model that overlooks a major household obligation can produce a reassuring answer to the wrong question.
What the percentage actually measures
Start with a definition of success. In the illustration below, success means the portfolio funds every scheduled withdrawal through the final modeled year. Another analysis might require a remaining inheritance, preserve principal, or fund essential expenses while allowing travel spending to change. Those are different objectives. Their percentages should not be compared as though they measure the same thing.
Suppose, purely as an example, 8,500 of 10,000 simulated paths meet the stated goal. The reported success rate is 85%. That is a count within the model, conditional on its inputs. It is not an independently established 85% chance that a real household will enjoy a comfortable retirement. FINRA's standards for investment analysis tools emphasize assumptions, limitations, and the hypothetical nature of simulated results. The rule applies to FINRA members; the distinction between a simulation and a promise is useful for any investor.1
I also want to see the unsuccessful paths. Running short near the end of a long retirement is different from being unable to fund essential expenses much earlier. Ask when shortfalls begin, how large they become, and whether the model assumes the household ignores every warning along the way.
Build the household before running the model
The starting portfolio should include assets available to support withdrawals. A residence, family business, or illiquid partnership should not be treated as spendable cash without a specific sale, borrowing, or distribution assumption. Separate those possibilities from resources already available.
Next, build annual spending and dependable income by year. Include taxes, health coverage, home repairs, family commitments, and major purchases. Benefits starting later should reduce portfolio withdrawals when they actually arrive. A level annual spending assumption may be useful for illustration, but it is seldom a complete household budget.
Investment inputs deserve equal attention. Expected returns, volatility, relationships among asset classes, rebalancing, and expenses all influence modeled outcomes. The SEC explains why investment fees reduce the amount left to compound.2 A model using returns before costs should not be compared casually with one using returns after costs.
Choose a horizon deliberately. Social Security's life expectancy calculator estimates an average from sex and birth date; it does not supply a household's guaranteed endpoint.3 For a couple, consider the possibility that one spouse outlives the other by many years. A longer horizon is a stress assumption, not a prediction of either person's lifespan.
An illustration of the decisions that move the result
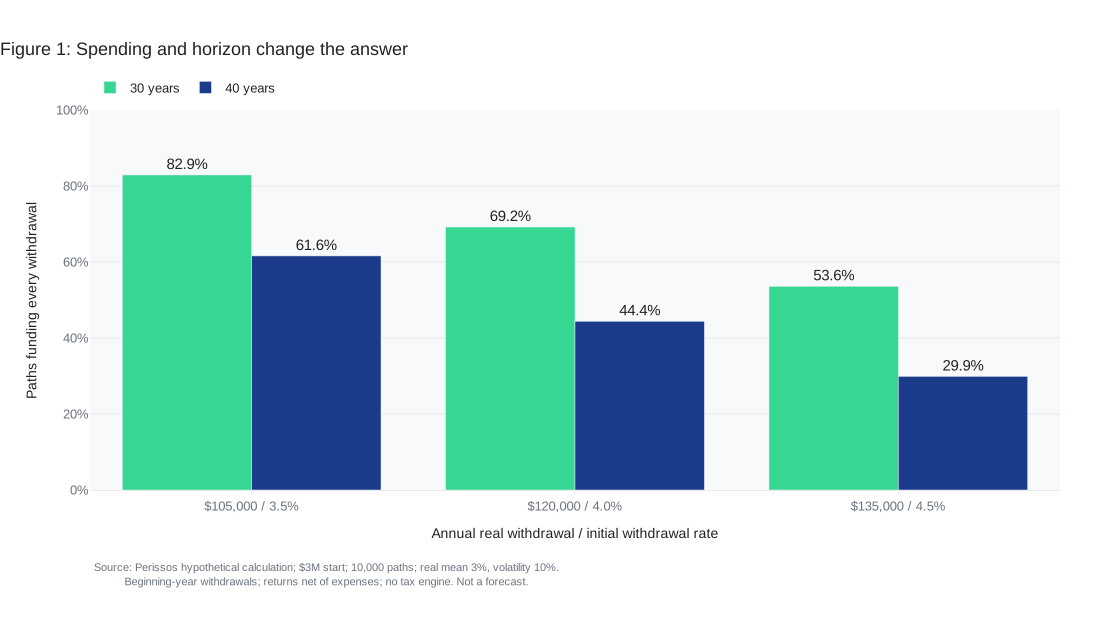
Figure 1 uses a hypothetical $3 million portfolio and 10,000 simulated paths. Annual withdrawals are $105,000, $120,000, or $135,000 in today's purchasing power, taken at the beginning of each year. These equal initial withdrawal rates of 3.5%, 4.0%, and 4.5%. Each draw represents the total portfolio cash requirement, including any taxes, after outside income. There are no later contributions or separate benefit increases in this simplified example.
The model assumes independent annual real returns with a 3% arithmetic mean and 10% standard deviation, after investment expenses. Returns follow a normal distribution, with a floor of minus 99%. Because the calculations use real dollars, inflation is already removed from returns and withdrawals stay constant in purchasing power. These are selected teaching assumptions, not estimates of current market returns or a recommended allocation.
At a $120,000 annual draw, 69.2% of paths fund all withdrawals over 30 years; 44.4% do so over 40 years. Reducing the draw to $105,000 raises those figures to 82.9% and 61.6%. Raising it to $135,000 lowers them to 53.6% and 29.9%. The calculations use identical random return paths across comparisons so the differences reflect spending and horizon choices rather than different random samples.
Figure 1 shows why a withdrawal percentage needs a time horizon attached. These results are hypothetical mathematical illustrations, not actual investment results, forecasts, or guarantees. The model does not calculate tax brackets, benefit eligibility, changing inflation, separate stock and bond returns, or household responses. Different assumptions, random samples, or model designs can produce different answers.
Stress the assumptions as well as the markets
Changing the random seed is not a sufficient stress test. I would also lower expected returns, increase the spending requirement, extend the horizon, and place a substantial expense early in retirement. Test one change at a time to understand the cause, then combine plausible adverse conditions to see whether the plan depends on everything going right.
Independent annual returns are convenient for demonstrating the math. They do not capture every feature of real markets, including prolonged regimes or changing relationships between investments. A large number of simulations reduces sampling noise within a model; it does not prove the model describes the world correctly. Historical replays and explicit adverse scenarios provide useful additional views, though history cannot include every future event.
The order of returns also matters when withdrawals are being made. Our discussion of sequence-of-returns risk using real market examples explains the mechanism. For a household near retirement, I would inspect the years immediately after the paycheck stops and ask which assets would fund spending if growth investments declined.
Do not try to improve a score simply by adding risk. A higher assumed return may help one part of the projection while larger losses make the plan harder to follow. Allocation should reflect both time horizon and willingness and ability to bear losses, as the SEC's guidance on asset allocation explains.4
Give flexibility a specific dollar amount
A model that assumes unchanging spending can understate the value of choices a household would actually make. But a model that assumes unlimited flexibility can overstate safety. Essential spending and discretionary spending need separate treatment.
For example, reducing an assumed $120,000 portfolio draw to $105,000 means finding $15,000 a year. Identify the expenses behind that reduction before calling it manageable. Postponing a renovation may be realistic; permanently reducing necessary care may not be. If flexible withdrawals are modeled, report the frequency, size, and duration of cuts alongside the probability of avoiding depletion.
Cash reserves can support that response, but they belong inside the total portfolio calculation. They should not be counted once as investments and again as an extra cushion. Our article on organizing retirement money into now, soon, and later connects this liquidity decision to the spending plan.
This analysis is particularly useful when comparing retirement dates, purchases, gifts, or sustainable spending ranges. It adds less value when the underlying budget is unreliable or a near-term obligation simply requires dependable funding. No simulated success percentage makes an upcoming tax payment optional.
Leave the review with a response plan
Ask for the assumptions in writing, the timing and size of shortfalls, and a comparison of choices you would genuinely consider. Coordinate account withdrawals and tax estimates with your CPA; involve your attorney when trusts, ownership, or estate commitments change which assets can fund the plan.
Then document the action triggers: the spending amount to review, the reserve to replenish, the purchase to defer, and the person responsible for each decision. Revisit the analysis after material changes in spending, assets, health, or family responsibilities. The useful result is a set of decisions you understand well enough to carry out when the comfortable assumptions no longer hold.
All my best,
Brandon VanLandingham, CFA, CMT, CFP
Founder / CIO
Citations
- FINRA, Rule 2214: Requirements for the Use of Investment Analysis Tools. Retrieved September 26, 2026.
- SEC Investor.gov, How Fees and Expenses Affect Your Investment Portfolio. July 23, 2025; retrieved September 26, 2026.
- Social Security Administration, Retirement & Survivors Benefits: Life Expectancy Calculator. Retrieved September 26, 2026.
- SEC Investor.gov, Asset Allocation and Diversification. Retrieved September 26, 2026.
Important Disclosures
This piece is educational. It is not legal, tax, or accounting advice and is not a recommendation to take or refrain from any specific action. Tax law is fact-specific and changes regularly. Please coordinate any decisions discussed here with your attorney, your CPA, and Perissos before acting.
Perissos Private Wealth Management is a Registered Investment Adviser ("RIA"). Registration as an investment adviser does not imply a certain level of skill or training, and the content of this communication has not been approved or verified by the United States Securities and Exchange Commission or by any state securities authority. Perissos Private Wealth Management renders individualized investment advice to persons in a particular state only after complying with the state's regulatory requirements, or pursuant to an applicable state exemption or exclusion. All investments carry risk, and no investment strategy can guarantee a profit or protect from loss of capital. Past performance is not indicative of future results.
The information contained in this newsletter is intended to provide general information about market themes. It is not intended to offer investment advice. Investment advice will only be given after a client engages our services by executing the appropriate investment services agreement. Information regarding investment products and services is given solely to provide education regarding our investment philosophy and our strategies. You should not rely on any information provided in making investment decisions.
Market data, articles and other content in this material are based on generally available information and are believed to be reliable. Perissos Private Wealth Management does not guarantee the accuracy of the information contained in this material.
Perissos Private Wealth Management will provide all prospective clients with a copy of our current Form ADV, Part 2A (Disclosure Brochure), Part 2B (Supplemental Brochures), and Part 3 (Client Relationship Summary) prior to commencing an advisory relationship. You can also view these documents at any time at adviserinfo.sec.gov or by contacting us requesting a copy.
Explore topics
Share this article
Last reviewed: September 26, 2026
Frequently Asked Questions
- What does a Monte Carlo success rate mean in a retirement plan?
- It is the share of simulated paths that meet a stated goal based on the model's assumptions. It is not a promise or a guaranteed real-world outcome.
- Why does time horizon matter in Monte Carlo retirement analysis?
- A withdrawal rate can look workable over 30 years and much weaker over 40 years. The article's example shows a 4.0% initial withdrawal funding all withdrawals in 69.2% of paths over 30 years but 44.4% over 40 years.
- What assumptions should be stress-tested besides market returns?
- The article suggests lowering expected returns, increasing spending, extending the horizon, and adding a major early retirement expense. Testing one change at a time helps show which assumption drives the result.