

Written and reviewed by Brandon VanLandingham, CFA, CMT, CFP® · Last updated October 23, 2026
Quantitative Investing Explained for Non-Math People
Understand the rules, the evidence, and the costs before trusting the model.
October 23, 2026
You do not need to solve an equation to evaluate a quantitative investment strategy. You need to understand what information it uses, how that information changes the portfolio, and why those decisions might help. A model can make an investment process more consistent. It cannot make the assumptions behind that process automatically correct.
I would start with a plain-English explanation rather than a performance chart. What does the strategy measure? What causes a purchase or sale? Which risks does it accept? Who can change the rules? If those questions cannot be answered without technical language, the investor has too little information to judge whether the approach belongs in a financial plan.
Rules turn information into decisions
Quantitative investing uses specified measurements and decision rules to guide investment choices. The SEC’s overview of quant and nontraditional index funds describes approaches that select or weight investments differently from traditional market-value indexes. The rules, holdings, risks, and costs deserve scrutiny; the label does not promise better results.1
Imagine an entirely hypothetical process that compares companies on two measures: price relative to earnings and a measure of financial strength. It ranks eligible companies, combines the rankings, and selects a diversified group under stated position limits. This is an example of a decision process, not a recommendation to buy whichever stocks rank highest on two variables.
The researcher still chooses the data, definitions, weights, investment universe, and constraints. A computer can apply those choices consistently, but consistency and soundness are different qualities. I would ask why the selected measurements should matter economically and what evidence would cause the team to revise that view. A model should make the reasoning inspectable, not hide it.
Our article Factor Investing: Value, Momentum, Quality, and Low Volatility Explained explores a related application. Quantitative methods can implement factor exposures, but the broader question remains the same: does the particular exposure improve the household’s portfolio at a cost and level of risk it can accept?
The signal is only the first step
A useful review follows information all the way to an executed portfolio. Begin with the data: where they come from, when they become available, and how missing or unusual observations are handled. Then examine how the measurements become rankings or forecasts. Finally, ask how those outputs become position sizes, trading instructions, and risk limits.
For example, a rule might rank a company attractively while a concentration limit prevents another purchase. A tax constraint might delay a sale. A liquidity constraint might reduce the size of a trade. These are hypothetical design choices, but they show why a research signal is not the same as an investable portfolio. The implementation rules can matter as much as the initial ranking.
I would also ask what happens when the process receives bad data or an exchange is unavailable. Who can pause trading? How are exceptions documented? Who approves a model change? Those governance questions are particularly important when the explanation emphasizes automation. Human judgment remains necessary to define the system and supervise its use.
A backtest asks a historical question
A backtest applies a proposed process to historical information to see what it would have produced under the test’s assumptions. It is not a record of actual investment results. The SEC’s Investor Bulletin: Performance Claims cautions that hypothetical backtested results should be distinguished from actual performance and examined with their limitations.2
My review would begin with a timeline. When were the rules chosen? Which dates were used to develop them? Which later dates, if any, were reserved for evaluation without further adjustment? When did real money begin following the process? Ask for those periods to be identified clearly instead of blended into one smooth growth chart.
Next, challenge what the model was allowed to know. A historical decision should use information available at that time, not a later revision or a financial result published afterward. Ask whether companies that disappeared remain in the research universe and whether the assumed trades could have been executed. These are quality-control questions that help reveal whether the simulated opportunity was actually available.
I would also ask how many variations were tried before the displayed version was selected. Choosing the most attractive result from many experiments can make chance look persuasive. Request sensitivity tests around important settings: does the conclusion survive a modest change in a ranking window, a transaction-cost estimate, or a start date? Fragile results deserve less confidence than a process supported by several coherent checks.
A small advantage can disappear in implementation
Figure 1 shows a hypothetical cost test for a $1 million allocation. Assume a proposed strategy has a gross advantage of 0.80 percentage points over a relevant comparison portfolio for one year. Assume an additional management cost of 0.30 percentage points. Then test three incremental trading-cost assumptions: 0.10, 0.40, and 0.80 percentage points. These are selected inputs, not estimates of achievable returns or industry expenses.
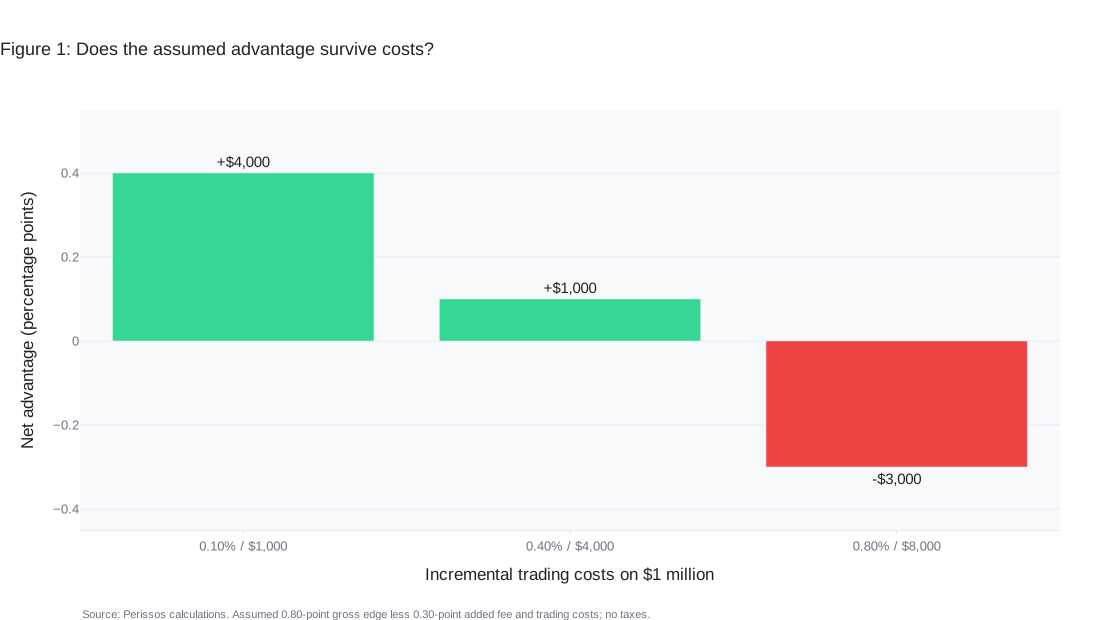
The gross advantage is $8,000 and the additional management cost is $3,000. Trading costs of $1,000 leave $4,000, or 0.40 percentage points, of advantage. Trading costs of $4,000 leave $1,000, or 0.10 percentage points. Trading costs of $8,000 leave a $3,000 disadvantage, or negative 0.30 percentage points. Taxes and other differences are excluded, and the calculation does not assume that the gross advantage will actually occur.
The exercise is useful because it converts a vague claim into a threshold. Under these assumptions, incremental trading costs of 0.50 percentage points consume the remaining advantage exactly. If the manager cannot explain how its turnover and execution assumptions relate to real trading, I would not treat the gross estimate as spendable return.
FINRA’s questions about rules-based investment products highlight methodology, turnover, costs, and the limitations of backtesting.3 In a taxable account, ask the CPA to evaluate realization patterns and existing embedded gains as well. A strategy can look attractive for new cash and still be an expensive transition for a household with a highly appreciated portfolio.
Decide what kind of disappointment is acceptable
Before investing, define the role and comparison. A strategy intended to reduce a particular exposure should not be judged only by whether it beats stocks in every rally. Conversely, a claim of superior returns should not escape evaluation merely because the process is sophisticated. Write down the intended benefit and the evidence that would support it.
Ask the manager to describe environments in which the process may struggle and show how those periods would affect the household. Would a disappointing stretch force spending cuts or an unplanned sale? Does the allocation repeat risks already present through employment, business ownership, or other funds? The model’s internal risk statistics should feed into those practical questions.
The planning use of models is developed in Stress-Testing Your Retirement Plan With Monte Carlo Analysis. Investment selection and retirement simulation are different tasks, but both require explicit assumptions and an understanding of what the output can support. A precise number is useful only when the underlying question and limitations are clear.
Keep the process accountable
Quantitative investing may suit a household that values a documented process, understands the targeted exposure, and can tolerate periods when that process is out of favor. It is a poor fit when the attraction is an impressive backtest, when implementation is opaque, or when a short-term cash need leaves no room for the stated risk. Complexity alone is not a reason to pay more.
Before allocating, request a concise methodology, a clear split between simulated and live results, a realistic cost analysis, and the rules for changing or overriding the model. Agree on a review schedule and identify events that warrant earlier attention, such as a material process change or unexplained departure from the mandate. Keep that record alongside the household investment policy.
The final test is whether you can explain the decision without referring to a mysterious algorithm: what it measures, why that might help, what it costs, and what could go wrong. That explanation gives the family a basis for staying invested when the process remains sound—and for asking better questions when the evidence changes.
All my best,
Brandon VanLandingham, CFA, CMT, CFP
Founder / CIO
Citations
- SEC Investor.gov, Smart Beta, Quant Funds and Other Non-Traditional Index Funds. Retrieved October 23, 2026.
- SEC, Investor Bulletin: Performance Claims. Retrieved October 23, 2026.
- FINRA, Smart Questions to Ask About Smart Beta Products: Part 2, November 16, 2017. Retrieved October 23, 2026. Figure 1 uses hypothetical incremental return and cost assumptions, not a backtest or forecast.
Important Disclosures
This piece is educational. It is not legal, tax, or accounting advice and is not a recommendation to take or refrain from any specific action. Tax law is fact-specific and changes regularly. Please coordinate any decisions discussed here with your attorney, your CPA, and Perissos before acting.
Perissos Private Wealth Management is a Registered Investment Adviser ("RIA"). Registration as an investment adviser does not imply a certain level of skill or training, and the content of this communication has not been approved or verified by the United States Securities and Exchange Commission or by any state securities authority. Perissos Private Wealth Management renders individualized investment advice to persons in a particular state only after complying with the state's regulatory requirements, or pursuant to an applicable state exemption or exclusion. All investments carry risk, and no investment strategy can guarantee a profit or protect from loss of capital. Past performance is not indicative of future results.
The information contained in this newsletter is intended to provide general information about market themes. It is not intended to offer investment advice. Investment advice will only be given after a client engages our services by executing the appropriate investment services agreement. Information regarding investment products and services is given solely to provide education regarding our investment philosophy and our strategies. You should not rely on any information provided in making investment decisions.
Market data, articles and other content in this material are based on generally available information and are believed to be reliable. Perissos Private Wealth Management does not guarantee the accuracy of the information contained in this material.
Perissos Private Wealth Management will provide all prospective clients with a copy of our current Form ADV, Part 2A (Disclosure Brochure), Part 2B (Supplemental Brochures), and Part 3 (Client Relationship Summary) prior to commencing an advisory relationship. You can also view these documents at any time at adviserinfo.sec.gov or by contacting us requesting a copy.
Frequently Asked Questions
- What is quantitative investing in plain English?
- Quantitative investing uses defined measurements and decision rules to guide portfolio choices. The key review points are what data the model uses, how those data change holdings, and what risks and costs the process accepts.
- Why should investors be cautious about backtests?
- A backtest shows how a proposed process would have behaved under historical assumptions, not how actual money performed. Results can be overstated if the model used unavailable data, ignored failed companies, or was selected from many trials.
- How can trading costs affect a quantitative strategy?
- Even a small estimated edge can disappear once management fees and trading costs are applied. In the post’s hypothetical example, a 0.80 percentage point gross advantage is fully offset when incremental trading costs reach 0.50 percentage points after a 0.3...