

Written and reviewed by Brandon VanLandingham, CFA, CMT, CFP® · Last updated November 2, 2026
What Technical Analysis Can (and Cannot) Tell Investors
Using price evidence without asking it to predict the future
November 02, 2026
A chart can show that an investment is weakening before the explanation becomes comfortable. It can also produce an urgent-looking warning that disappears a few days later. Both possibilities matter. The useful question is what a technical observation changes about a portfolio decision, and what the investor is prepared to do if that observation proves misleading.
I view technical analysis as one input to risk management. It can organize evidence about price behavior and impose discipline on decisions. It cannot determine how much your family needs to spend, establish a business's intrinsic value, or make uncertainty disappear. Those boundaries should be clear before an indicator becomes a reason to trade.
What the chart is measuring
Technical analysis examines market information such as prices, volume and price relationships. The CFTC's explanation of trading systems distinguishes these inputs from analysis of underlying economic fundamentals.1 A price trend describes direction over a specified interval. Relative strength compares one investment's performance with another. Neither observation, by itself, explains why investors are buying or selling.
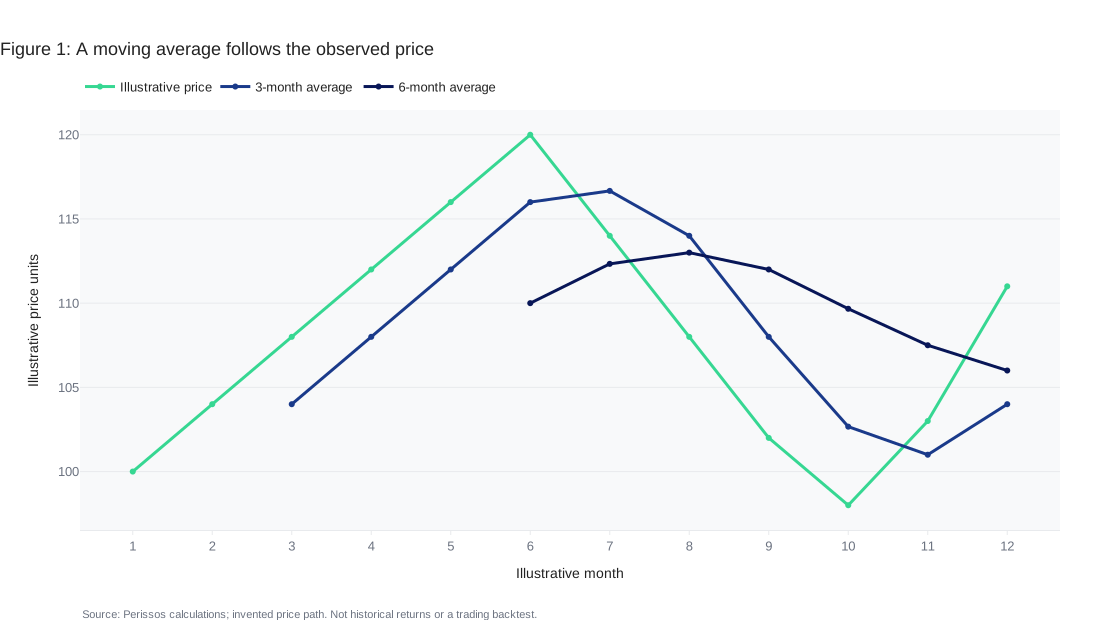
Consider a simple moving average: add a chosen number of recent closing prices and divide by that number. Each new observation replaces the oldest one. A shorter window reacts more strongly to recent changes; a longer window includes more older information. The calculation is objective once the inputs are fixed. Choosing the window and deciding what to do with it still require judgment.
Volume adds information about trading activity, but substantial activity does not establish that buyers are correct. Likewise, a security can outperform a falling benchmark while still losing money. The question must specify whether the goal is relative performance, preservation of purchasing power, or funding an upcoming withdrawal. Our discussion of value, momentum, quality and low volatility explains how different investment characteristics can create different portfolio exposures.
Faster information has a cost
Figure 1 uses an entirely invented sequence of twelve monthly prices to compare a three-month and six-month simple moving average. The assumed prices rise from 100 to 120, fall to 98, and recover to 111. At month eight, the price is 108, the three-month average is 114, and the six-month average is 113. Both averages remain above the price because they still contain earlier, higher observations.
At month twelve, the price is back to 111. The shorter average is 104, while the longer average is about 106. This is arithmetic, not a trading recommendation. The series was deliberately constructed to show a rise, reversal and recovery; it is not market history, a backtest or a probability estimate. It omits dividends, fees, taxes and actual trading because it illustrates an indicator rather than an investment strategy.
The practical tension is between responsiveness and stability. A rule that reacts to small changes may reverse itself repeatedly when prices fluctuate around its threshold. A rule that waits for more confirmation can allow a larger decline before acting and can respond slowly to a recovery. There is no universally correct compromise. The choice depends on the portfolio's purpose, the cost of acting, and the cost of being wrong.
Observation is different from prediction
It is reasonable to say that a price has fallen below a defined average. It is a much stronger claim to say that another decline must follow. The first statement is directly observable. The second requires evidence about what happened after similar signals, with enough cases and realistic implementation assumptions to make the analysis useful.
An apparent pattern can also depend on choices made after the outcome is known. An analyst who tries many windows, markets and exceptions may find an impressive historical result simply because enough alternatives were examined. I would ask which rules were specified in advance, which observations were reserved for evaluation, and whether nearby parameter choices produce radically different conclusions. A result that works only under one highly specific specification deserves more scrutiny.
The SEC's guidance on performance claims emphasizes that backtested results are hypothetical and that fees, benchmarks and the periods selected affect interpretation.2 Request a clear separation between actual results and simulated results. Also ask how much of the outcome came from holding less risk rather than from a uniquely informative signal.
A signal is not an execution price
Suppose an investor chooses to review a position after a specified decline. That review threshold is a governance decision. It does not guarantee that the position can be sold at the threshold. Prices can change before an order reaches the market, and a large order may have practical execution constraints.
FINRA's explanation of stop orders makes the distinction concrete: a stop becomes a market order when triggered, and the execution price may differ substantially from the trigger price. A stop-limit order controls the acceptable price but may not execute.3 Neither creates a guaranteed maximum loss. An investor who cannot withstand a larger decline should not treat an order instruction as a substitute for an appropriate position size.
For a taxable household, implementation also needs a review of available lots, expected realized gains and the consequences of subsequent purchases. Coordinate those questions with the CPA before adopting a process that may generate frequent transactions. The appropriate response to weakening evidence may be a smaller position, a review of spending reserves, or no change after considering the whole plan. It need not be an all-or-nothing exit.
Who may benefit, and who may be poorly served
A documented technical framework may help an investor who otherwise changes course whenever headlines become unsettling. Specifying the evidence that prompts review can make decisions more consistent. It can also give an investment committee a common language for discussing changing conditions. Those are process benefits; they do not establish superior returns.
It can be a poor fit when the investor expects to avoid every decline or capture every rebound. It also deserves caution when trading costs or embedded gains are substantial, when assets cannot be traded readily, or when the investor will abandon the rule after a few disappointing decisions. A complicated signal does little good if the household cannot follow its consequences.
For retirees, the spending plan remains central. Our explanation of active drawdown management connects portfolio losses with liquidity and withdrawals. A technical signal cannot refill a depleted reserve by itself. The investment process and the household's cash needs must be evaluated together.
Write the decision before the next signal
Before relying on a technical rule, document the instrument, data source, observation frequency and exact condition being measured. Specify who reviews the signal, how much exposure may change, what happens to the proceeds, and what evidence allows reinvestment. An exit process without a return process leaves a major decision unresolved.
Then test the household's willingness to accept the uncomfortable case: selling before a rebound, remaining invested through an initial decline, or lagging a rising market while holding more liquidity. I would rather resolve those tradeoffs in a calm planning conversation than discover them after the first difficult signal. The next useful step is to place the proposed rule beside the spending plan, tax picture and written investment policy, and decide whether its actual decisions fit the family's needs.
All my best,
Brandon VanLandingham, CFA, CMT, CFP
Founder / CIO
Citations
- CFTC, Commodity Trading Systems Sold on the Internet (retrieved October 23, 2026).
- SEC, Investor Bulletin: Performance Claims (retrieved October 23, 2026).
- FINRA, Stop Orders: Factors to Consider During Volatile Markets (retrieved October 23, 2026).
Important Disclosures
This piece is educational. It is not legal, tax, or accounting advice and is not a recommendation to take or refrain from any specific action. Tax law is fact-specific and changes regularly. Please coordinate any decisions discussed here with your attorney, your CPA, and Perissos before acting.
Perissos Private Wealth Management is a Registered Investment Adviser ("RIA"). Registration as an investment adviser does not imply a certain level of skill or training, and the content of this communication has not been approved or verified by the United States Securities and Exchange Commission or by any state securities authority. Perissos Private Wealth Management renders individualized investment advice to persons in a particular state only after complying with the state's regulatory requirements, or pursuant to an applicable state exemption or exclusion. All investments carry risk, and no investment strategy can guarantee a profit or protect from loss of capital. Past performance is not indicative of future results.
The information contained in this newsletter is intended to provide general information about market themes. It is not intended to offer investment advice. Investment advice will only be given after a client engages our services by executing the appropriate investment services agreement. Information regarding investment products and services is given solely to provide education regarding our investment philosophy and our strategies. You should not rely on any information provided in making investment decisions.
Market data, articles and other content in this material are based on generally available information and are believed to be reliable. Perissos Private Wealth Management does not guarantee the accuracy of the information contained in this material.
Perissos Private Wealth Management will provide all prospective clients with a copy of our current Form ADV, Part 2A (Disclosure Brochure), Part 2B (Supplemental Brochures), and Part 3 (Client Relationship Summary) prior to commencing an advisory relationship. You can also view these documents at any time at adviserinfo.sec.gov or by contacting us requesting a copy.
Frequently Asked Questions
- What can technical analysis realistically help investors do?
- It can organize observable evidence such as price trends, moving averages, and volume so investors can review risk more consistently. It is best used as one input to a broader portfolio and planning process.
- Can technical analysis predict future market declines or rebounds?
- No. A chart signal can describe what has happened or what is happening, but it does not prove that a specific future move must follow.
- Do stop orders guarantee a maximum loss?
- No. A stop order generally becomes a market order when triggered, so the execution price may differ from the stop price, while a stop-limit order may not execute at all.