
War, Oil, and the Path Forward
Assessing the Iran Conflict’s Impact on Markets, Inflation, and Portfolios
April 1, 2026
It has been just over a month since the United States and Israel launched coordinated airstrikes against Iran on February 28. In the thirty-two days since, financial markets have been whipsawed by a relentless cycle of escalation, retaliation, diplomatic signals, and military operations. Today feels like the right moment to step back from the headlines, take stock of where we actually stand, and think clearly about what comes next for your portfolio and for the broader economy.
I want to be direct with you: this is a serious situation with real economic consequences. But it is also a situation where discipline, historical perspective, and clear thinking matter far more than reactionary decision-making. Let me walk you through what has happened, what it means, and how we are positioning accordingly.
The Conflict So Far
On February 28, US and Israeli forces launched surprise airstrikes on sites and cities across Iran, killing Supreme Leader Ali Khamenei and several other senior Iranian officials, while inflicting dozens of civilian casualties. Iran responded with missile and drone strikes against Israel, US bases, and US-allied positions across the Middle East. Three American service members were killed in the initial days.
The conflict has since expanded well beyond Iran's borders. Hezbollah's engagement with Israel escalated into what is now being called the 2026 Lebanon war. Houthi forces intensified attacks in the Red Sea. Strikes have affected civilian infrastructure in Azerbaijan, Kurdistan, and Oman. A drone struck Britain's Akrotiri military base in Cyprus. The regional conflagration that many analysts had long feared has, in large part, materialized.
The most consequential escalation came on March 8, when Iran effectively closed the Strait of Hormuz to vessel traffic. The Strait carries roughly 20 million barrels per day of crude oil --- approximately 20% of the world's seaborne oil trade --- along with significant volumes of liquefied natural gas. The United States began military operations to forcibly reopen the Strait on March 19, but those efforts remain ongoing.
As of today, Trump's 15-point peace proposal has been rejected by Iran, which issued a 5-point counteroffer demanding continued control over the Strait. Trump has set an April 6 deadline for resuming strikes on Iran's energy infrastructure. This morning, the President claimed that Iran's president had asked for a ceasefire; Iran immediately denied this, calling the remarks "false and baseless." No ceasefire is imminent.
Oil and Energy --- The Heart of the Matter
There is no way around it: this is the largest disruption to global oil supply since the 1973 Arab oil embargo. And the numbers reflect it.
Brent crude surged from $72.48 per barrel on February 28 to a peak of $126 --- a 74% spike and the strongest monthly rally on record, dating back to 1988. As of this writing, Brent has pulled back to roughly $102 and WTI to $99.46, largely on de-escalation signals and the temporary pause on strikes against Iran's power plants. But these prices remain dramatically elevated from where we started the year.
At the consumer level, the national average for gasoline has hit $4.06 per gallon, up from $2.92 before the conflict --- an increase of $1.14 in just over four weeks. That is real money for American families, particularly those in lower-income brackets for whom fuel costs represent a larger share of household spending.
The international response has been significant but insufficient to fully offset the disruption. The International Energy Agency announced the largest coordinated reserve release in its 50-year history: 400 million barrels, with the United States contributing 172 million from the Strategic Petroleum Reserve. OPEC+ pledged an additional 206,000 barrels per day of output --- but that is a drop in the bucket against the 4.5 to 5 million barrels per day of lost Strait traffic, a figure estimated to double by mid-April if the waterway remains closed.
The range of outcomes from here is extraordinarily wide. Goldman Sachs expects Brent to average $115 in April, retreating to $80 by year-end assuming roughly six weeks of total Hormuz disruption. Macquarie Group has warned that oil could hit $200 per barrel if the war drags into June. Resolution timing is everything.
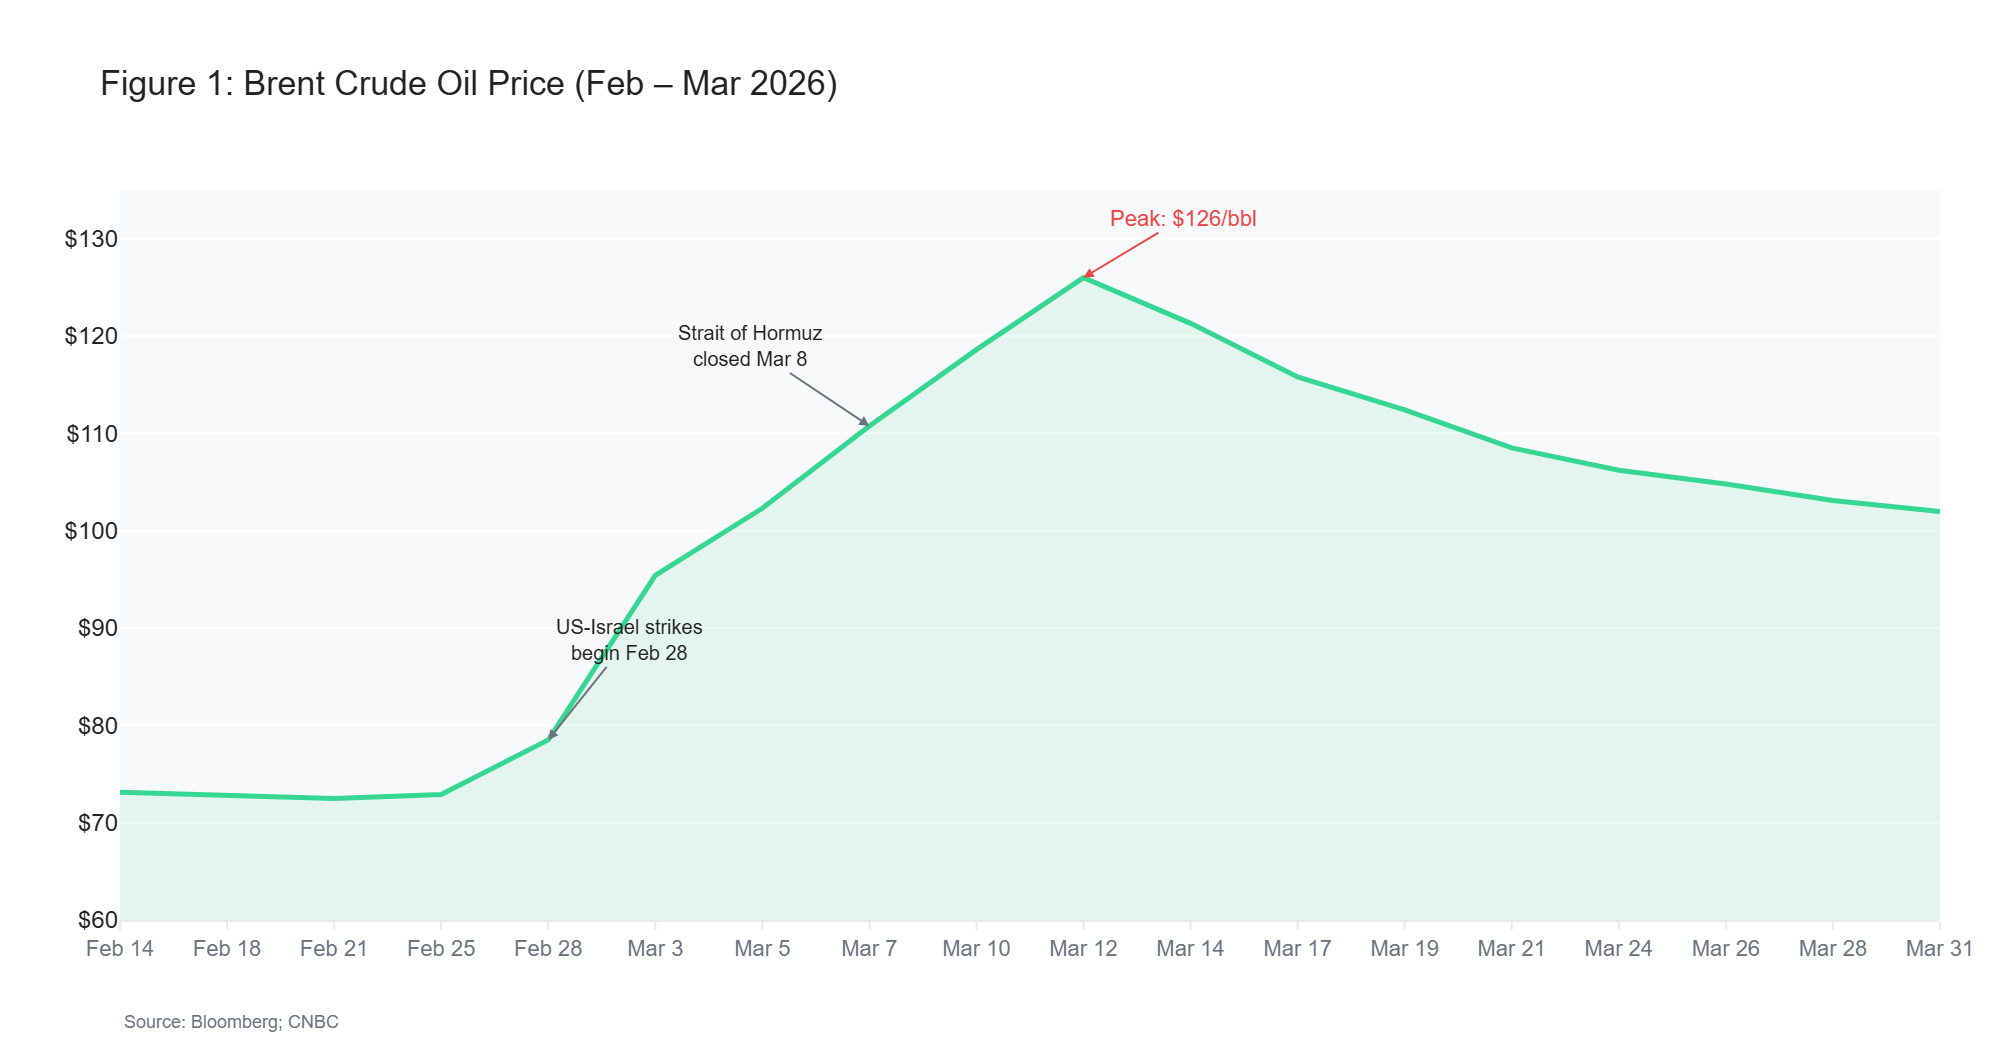
Figure 1: Brent Crude Oil Price (Feb – Mar 2026)
Equity Markets --- Volatile and Headline-Driven
The S&P 500 fell 5.09% in March and 4.6% for the first quarter --- the worst quarterly performance since 2022. The Nasdaq entered correction territory, declining 7.1% for Q1. And yet, on March 31 alone, the Dow Jones Industrial Average surged 1,125 points on peace hopes, recovering roughly 30% of the war's total drawdown in a single trading session. That is the kind of market we are in: violently reactive to every diplomatic signal, in both directions.
The sector rotation has been stark. Energy is the clear winner --- Exxon Mobil posted its largest quarterly gain in years, and names like Occidental Petroleum and Valero Energy have thrived. Technology has held up surprisingly well, treated by many investors as a defensive play in uncertain times. On the other side, materials stocks have been the worst-performing sector, down 10.3%. Airlines and travel companies have been hammered by flight cancellations and airspace rerouting. Banks and consumer staples have also suffered meaningful declines.
The key dynamic to understand is this: every whisper of de-escalation triggers sharp rallies; every escalation reverses them. The March 31 rally --- which added $1.7 trillion in market capitalization in a single day --- illustrates how desperately markets are pricing in a "peace dividend." This is not a market environment for reactive decision-making. It is an environment for discipline.
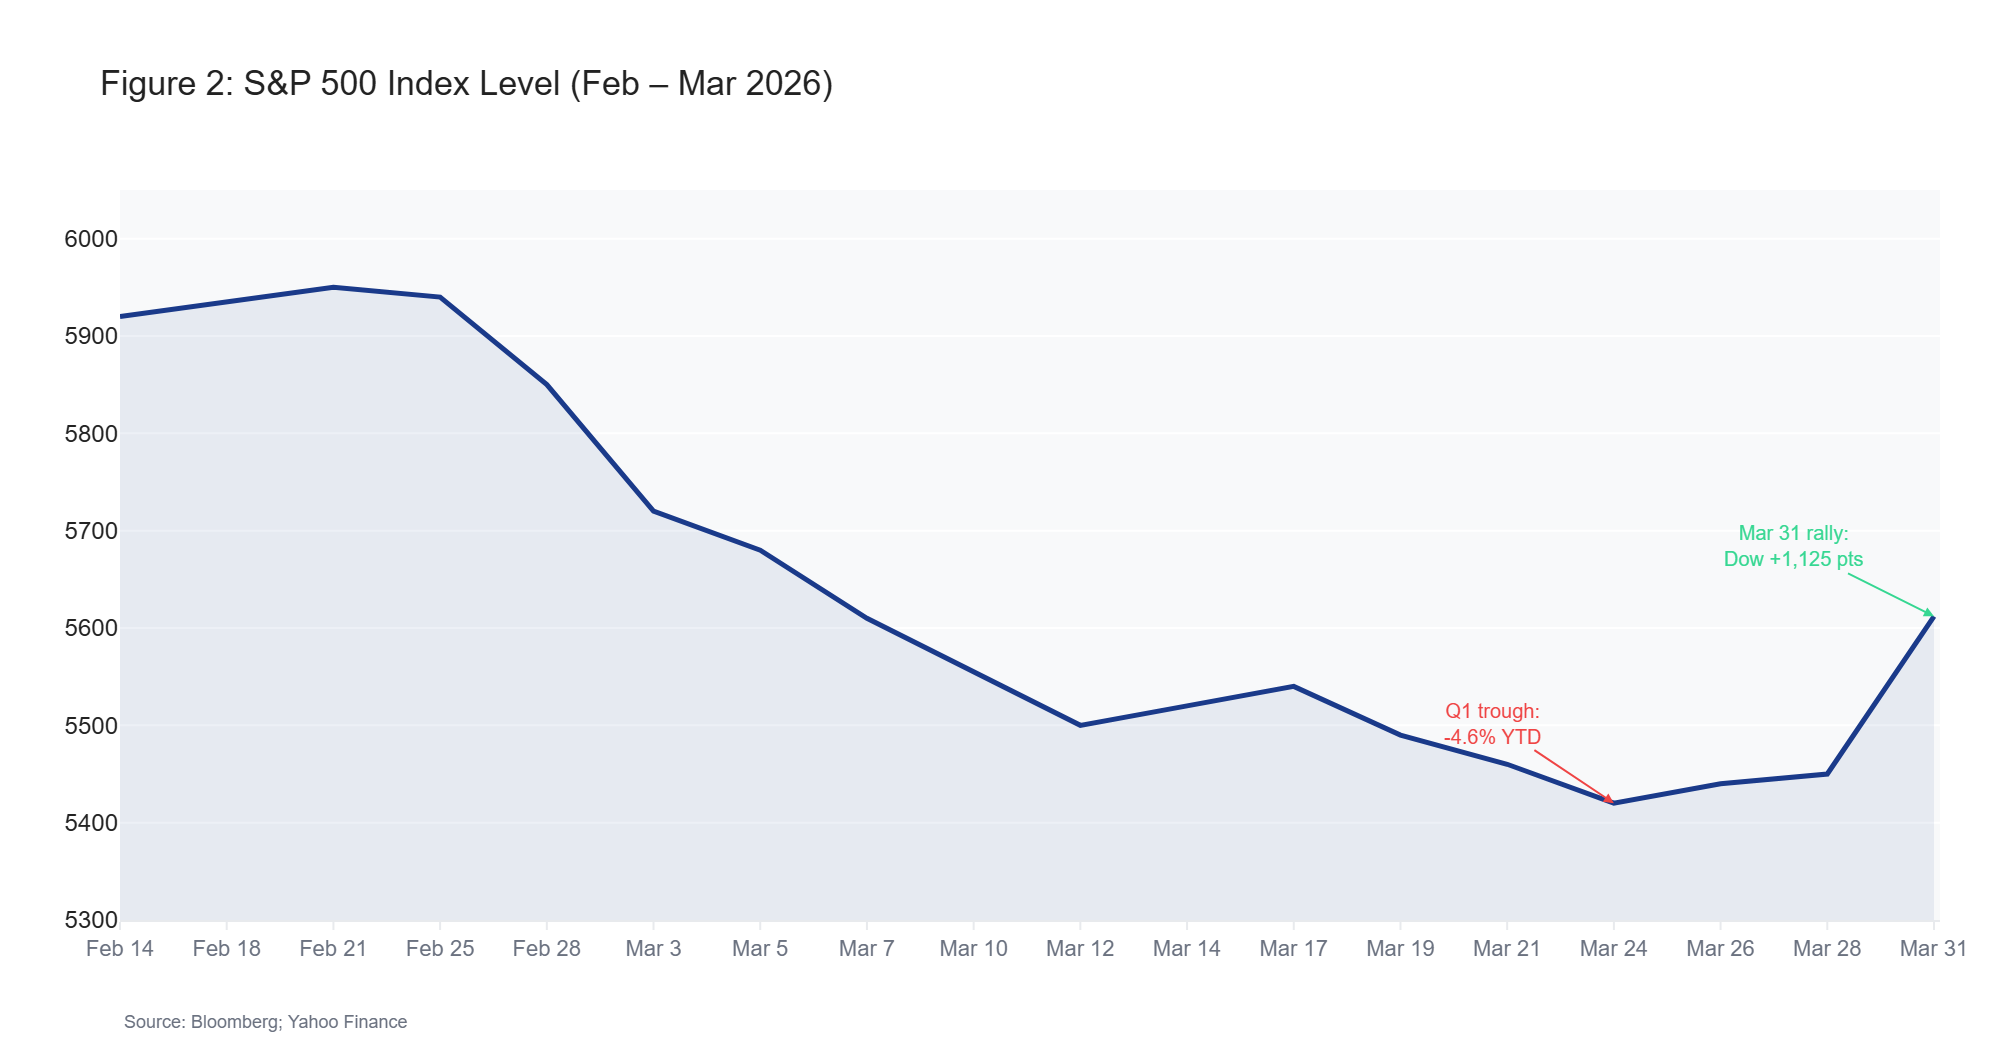
Figure 2: S&P 500 Index Level (Feb – Mar 2026)
The Bond Market Surprise
Here is something that has caught many investors off guard. Normally during geopolitical crises, money rushes into Treasury bonds for safety, pushing prices up and yields down. This time, the opposite has happened. The 10-year Treasury yield has climbed to 4.43%, meaning bond prices have fallen. The traditional safe-haven trade has not worked.
Why? Because investors fear the inflationary impact of surging energy prices more than they desire the safety of government bonds. Higher oil means higher inflation expectations, and higher inflation expectations mean the Federal Reserve cannot cut interest rates as aggressively as markets had hoped. Before the conflict, markets priced in two rate cuts in 2026. Now, at most one cut is expected --- likely in December --- and some economists see zero cuts this year. A few have even raised the specter of rate increases if energy-driven inflation becomes entrenched.
The Fed held rates at 3.50% to 3.75% at its March 18 meeting. Chair Powell called the oil crisis effects "possibly temporary" but acknowledged the conflict "complicates" the inflation outlook. He emphasized that Americans' inflation expectations will shape the Fed's response --- a telling signal that the central bank is watching psychology as much as data.
The Fed is caught in a classic bind: inflation rising from energy costs at the same time that economic growth is decelerating. This is the textbook definition of stagflation risk, and it is the most challenging policy environment a central bank can face.
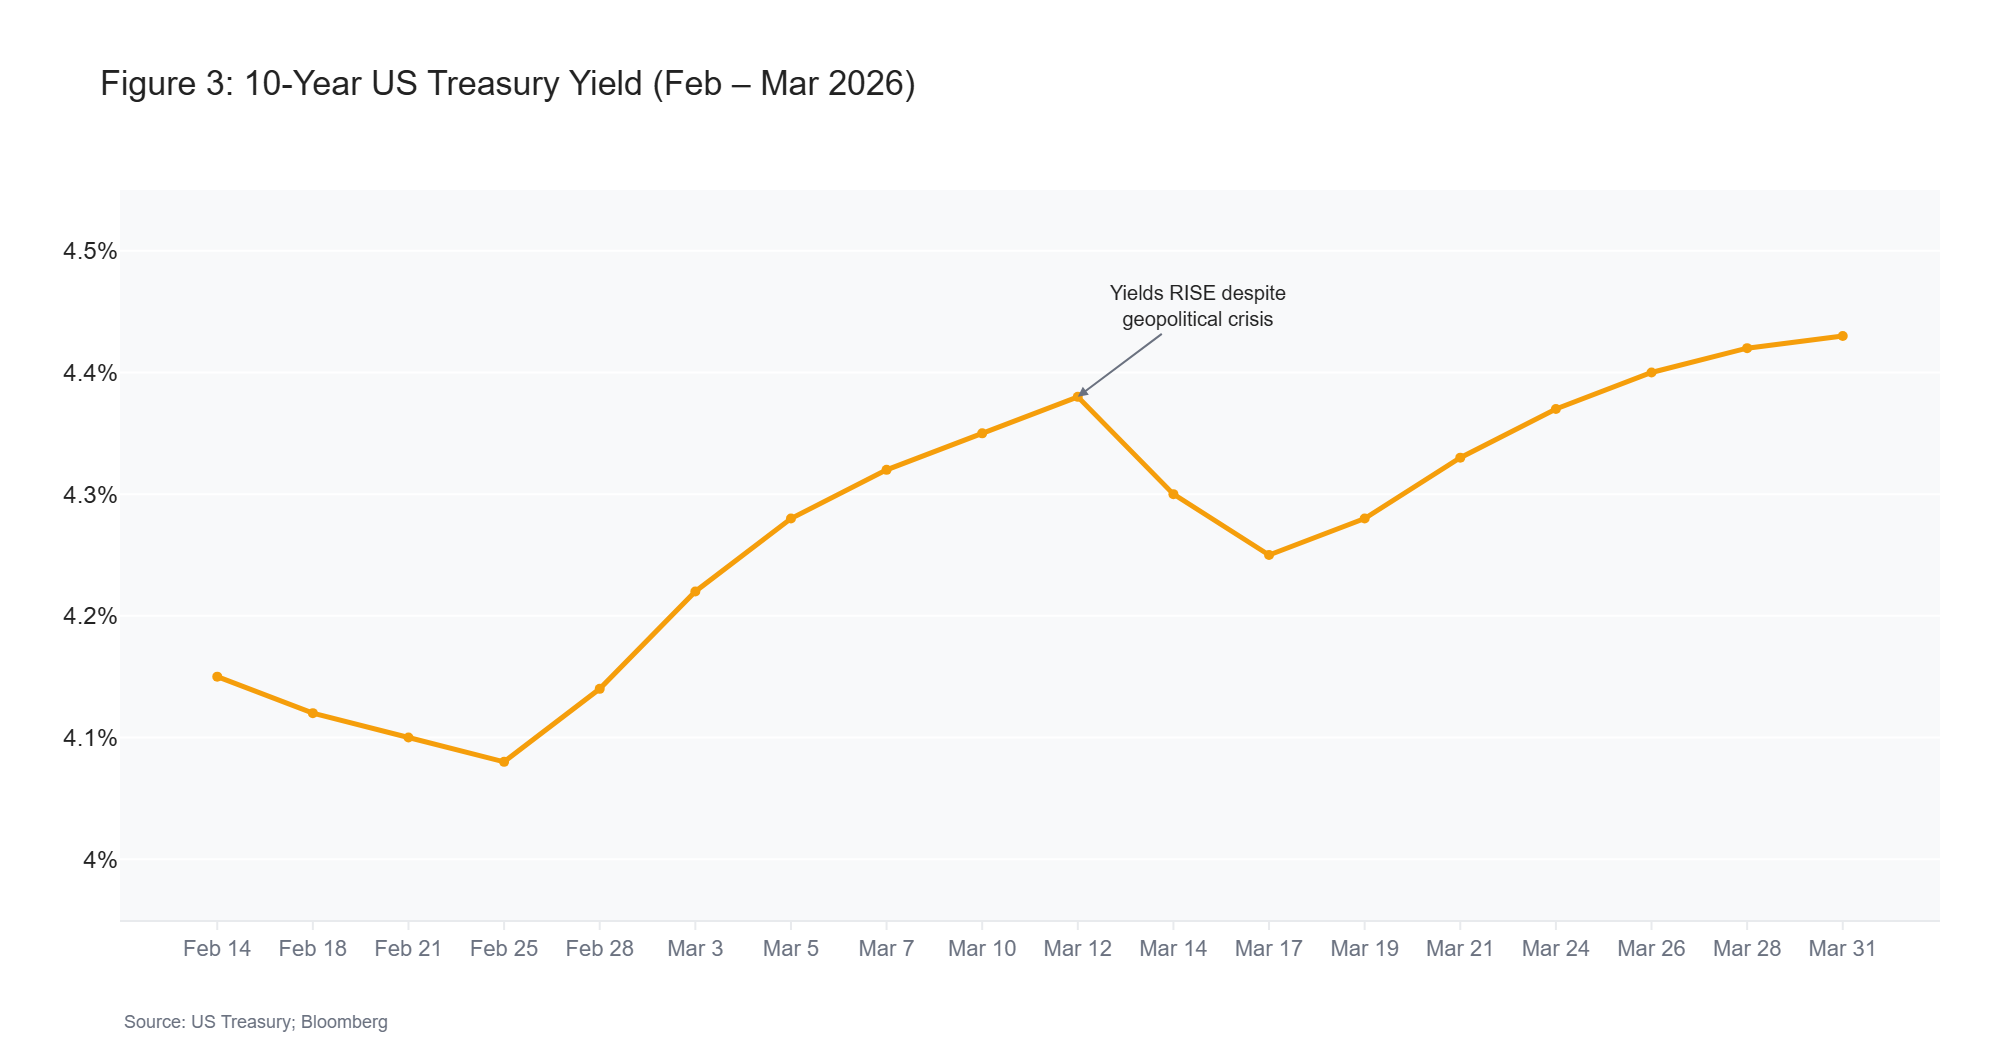
Figure 3: 10-Year US Treasury Yield (Feb – Mar 2026)
Inflation --- The Real Risk
Let me be clear about why inflation is the variable I am watching most closely.
The last Consumer Price Index reading, for February, showed 2.4% annual inflation. That was before the war. Since then, the OECD has raised its US inflation forecast to 4.2% for 2026 --- up a full 1.2 percentage points from its prior estimate. Goldman Sachs revised headline PCE inflation to 2.9% and core PCE to 2.4%. If oil averages $100 per barrel for the rest of the year, CPI could reach 3.5% by December.
The word "stagflation" has re-entered the financial vocabulary for the first time since the 1970s --- and not without reason. The inflationary impulse from energy does not stop at the gas pump. Diesel powers farm equipment, construction machinery, and freight trucks. When diesel prices rise, the cost of growing food, building homes, and shipping goods rises with it. By April, analysts expect consumers will begin seeing the impact at supermarkets and on online orders as higher transportation costs flow through supply chains.
Higher gasoline prices disproportionately squeeze lower-income households, where fuel represents a larger share of spending. This is not just an investment concern; it is a consumer spending concern that feeds directly into economic growth projections. Goldman Sachs has revised Q4 2026 GDP growth down to 2.2%, and unemployment is expected to rise to 4.6% by year-end from 4.4% in February.
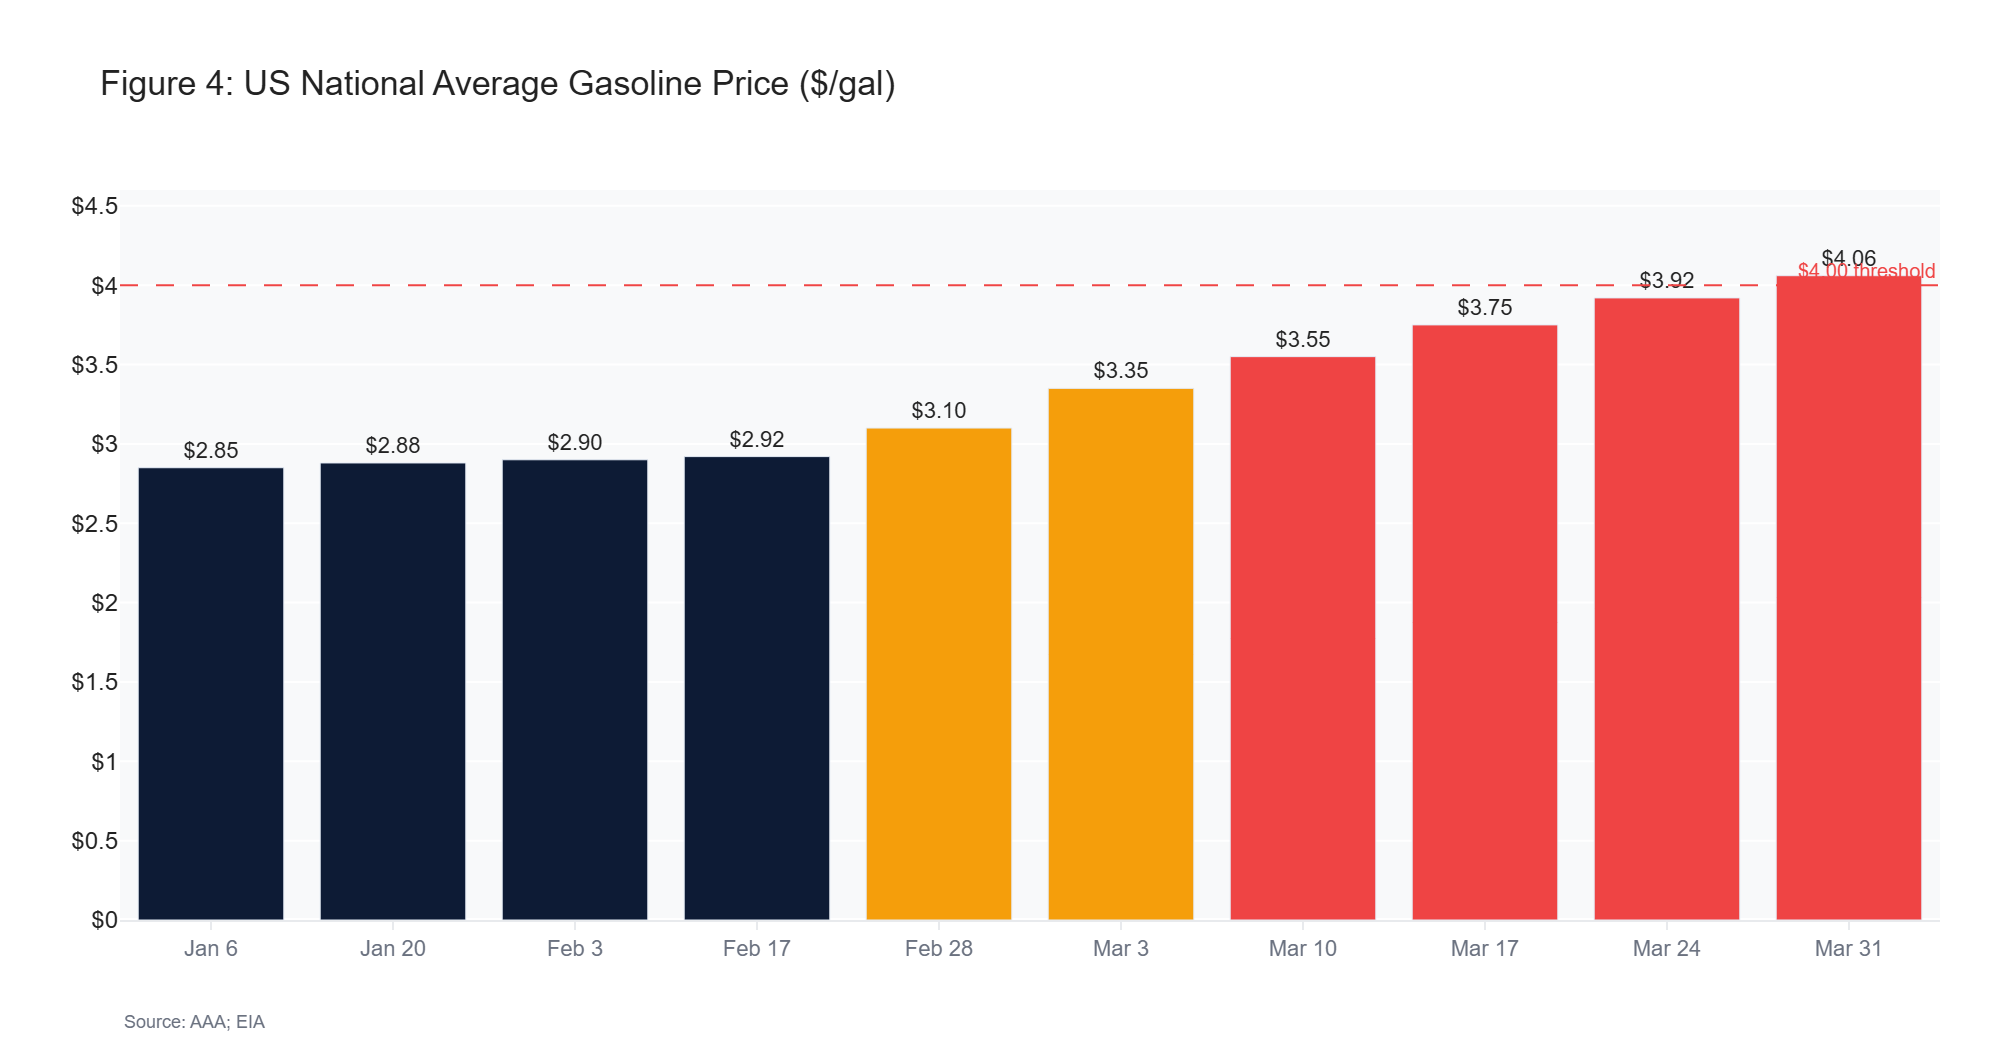
Figure 4: US National Average Gasoline Price ($/gal)
Gold and Safe Havens --- A Paradox
Gold initially rallied to $5,423 per ounce immediately after the February 28 strikes, but then sold off 6%, settling into a $5,050 to $5,200 trading range through late March. For an asset class that is supposed to shine during wartime, this is counterintuitive.
The explanation lies in the US dollar's strength and rising Treasury yields. The Dollar Index hit a ten-month high of 100.5 in March, driven by safe-haven capital flows and diminishing expectations for Fed rate cuts. A strong dollar makes gold more expensive for international buyers, while rising yields increase the opportunity cost of holding a non-yielding asset. These forces have overwhelmed gold's traditional wartime bid.
Long-term, analysts remain bullish. J.P. Morgan targets $6,300 per ounce by year-end, and Deutsche Bank sees $6,000. But in the near term, the dollar's strength is a headwind, and gold's underperformance is a reminder that financial markets rarely behave exactly as textbooks predict, especially when multiple forces are pulling in different directions simultaneously.
Historical Perspective
Context matters enormously right now. The closest historical parallel to the current situation is the 1973 Arab oil embargo, when OPEC nations cut supply and oil quadrupled from $3 to $12 per barrel. The S&P 500 fell 16%, and inflation became entrenched for years, requiring the brutal Volcker rate hikes of the early 1980s to finally break the cycle.
But there are important differences. The US economy today is far less oil-dependent than it was in the 1970s. Energy spending as a share of GDP has declined significantly over five decades of efficiency gains, technological advancement, and fuel diversification. The shale revolution has made America a net energy exporter, providing a structural buffer that simply did not exist fifty years ago.
The 1990 Gulf War offers a more optimistic analogy. When Iraq invaded Kuwait, oil doubled from $17 to $36 per barrel and the S&P fell nearly 16%. But swift, decisive military action resolved the crisis relatively quickly, and markets recovered within months. If the current conflict follows a similar trajectory --- if the Strait reopens within weeks and diplomatic resolution gains traction --- the economic damage may prove manageable.
The current situation falls somewhere between these scenarios. The oil price shock of 74% is significant but not unprecedented. Recession probability, currently pegged at 30% by Goldman Sachs, 35% by HSBC, and 49% by Moody's, is elevated but not a foregone conclusion. The path from here depends almost entirely on resolution timing.
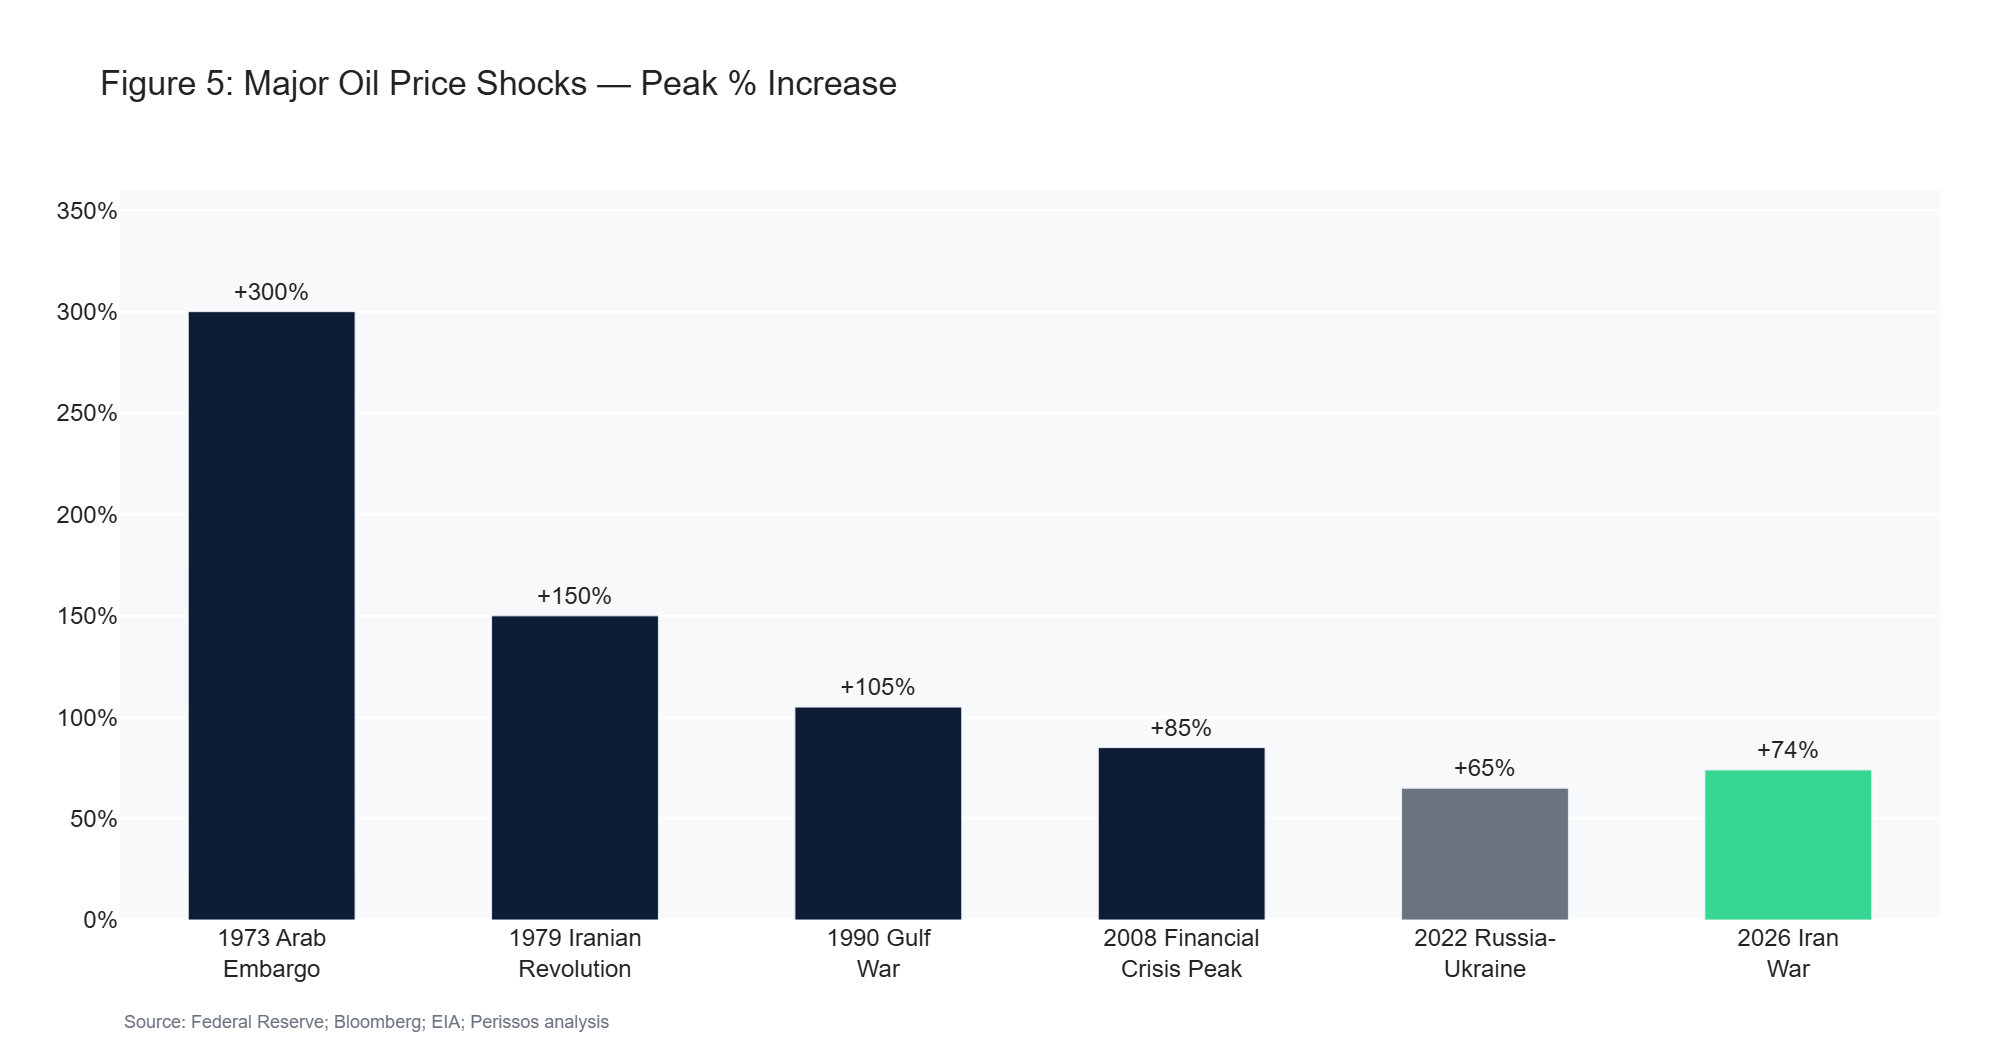
Figure 5: Major Oil Price Shocks — Peak % Increase
What We Are Watching
Several specific signposts will shape markets and our positioning in the weeks ahead.
April 6 is the next critical date --- the deadline Trump has set for resuming strikes on Iran's energy infrastructure if diplomatic progress stalls. Diplomatic signals between now and then will move markets sharply. We are watching crude oil's trajectory closely: a sustained move back above $120 per barrel would signal that the market has lost confidence in near-term resolution, while a drift toward $90 would suggest the worst of the supply disruption is being priced out.
The Federal Reserve's language on inflation expectations will be closely monitored. If the Fed begins signaling that energy-driven inflation is becoming embedded in consumer expectations, the rate path could shift hawkish in a way that would pressure both equities and bonds simultaneously.
Finally, we are watching recession probability estimates, which have already risen materially. If Goldman moves above 35% or Moody's crosses 50%, the market's risk calculus shifts meaningfully, and defensive positioning becomes more appropriate.
Portfolio Positioning and Guidance
This is not the time for dramatic portfolio changes driven by daily headlines. I want to be very clear about that. History shows that geopolitical conflicts, even severe ones, tend to be resolved on timescales that markets can ultimately digest. Investors who sell into fear during crises consistently underperform those who maintain discipline.
Our approach is straightforward. We are maintaining diversification across asset classes, ensuring adequate cash reserves for clients with near-term liquidity needs, and recognizing that volatility creates opportunity for disciplined investors with longer time horizons. Energy exposure has been a valuable hedge during this period, and we are thoughtful about how we manage that exposure as the conflict evolves. Fixed income requires careful duration management given the unusual yield dynamics --- this is not a typical flight-to-safety environment.
We continue to favor quality across asset classes: companies with strong balance sheets, pricing power, and the ability to maintain margins in an inflationary environment. We remain disciplined in our process, even when --- especially when --- headlines tempt reactive behavior.
I will continue to monitor these developments closely and will keep you informed as the situation evolves. The weeks ahead will be consequential, and I believe that clarity, patience, and discipline will be rewarded.
As always, if you have questions or concerns about your specific portfolio, please do not hesitate to reach out directly.
All my best,
Brandon VanLandingham, CFA, CMT, CFP
Founder/Chief Investment Officer
Important Disclosures
Perissos Private Wealth Management is a Registered Investment Adviser ("RIA"). Registration as an investment adviser does not imply a certain level of skill or training, and the content of this communication has not been approved or verified by the United States Securities and Exchange Commission or by any state securities authority. Perissos Private Wealth Management renders individualized investment advice to persons in a particular state only after complying with the state's regulatory requirements, or pursuant to an applicable state exemption or exclusion. All investments carry risk, and no investment strategy can guarantee a profit or protect from loss of capital. Past performance is not indicative of future results.
The information contained in this newsletter is intended to provide general information about market themes. It is not intended to offer investment advice. Investment advice will only be given after a client engages our services by executing the appropriate investment services agreement. Information regarding investment products and services is given solely to provide education regarding our investment philosophy and our strategies. You should not rely on any information provided in making investment decisions.
Market data, articles and other content in this material are based on generally available information and are believed to be reliable. Perissos Private Wealth Management does not guarantee the accuracy of the information contained in this material.
Perissos Private Wealth Management will provide all prospective clients with a copy of our current Form ADV, Part 2A (Disclosure Brochure), Part 2B (Supplemental Brochures), and Part 3 (Client Relationship Summary) prior to commencing an advisory relationship. You can also view these documents at any time at adviserinfo.sec.gov or by contacting us requesting a copy.